Flow Cytometry
By: Carolina A. Herrera
Difficulty Rating: ![]()
What is the general purpose?
Flow cytometry is a technique used to count and analyze the size, shape, and properties of individual cells within a heterogenous (mixed) population of cells. In flow cytometry, cells are tagged with antibodies which are proteins produced by immune cells, cells that protect against infection. In flow cytometry, antibodies are fluorescently-labeled and recognize and bind to specific proteins on the surface of cells. Cells are then passed through a flow cytometer machine which uses a laser and a photodetector (a light sensor) to detect and count the fluorescently-labeled cells.
Why do we use it?
Flow cytometry has many applications such as assessing cell viability (quantification of live and dead cells), identifying and quantifying cell surface proteins, and identifying proteins in cell signaling pathways. Flow cytometry is widely used in clinical research to identify and quantify cells in the blood, bone marrow, and other bodily fluids. In particular, flow cytometry is an important tool that doctors use to diagnose different cancers, including leukemias. They use flow cytometry to identify the type of cells in a blood sample and look to see if there are cancerous cells present. Flow cytometry can detect cancerous cells based on the presence or absence of certain cell surface proteins. To confirm a leukemia diagnosis flow cytometry can be done on cells from the bone marrow to test for abnormal cell count and abnormal surface proteins.
How does it work?
Flow cytometry involves multiple steps. Many different types of samples (blood, urine, saliva) can be analyzed by flow cytometry. Blood is used very often in clinical research and in diagnosis of diseases. Blood contains many types of immune cells which have different functions in protecting us from infection and disease. Examples of immune cells are T cells and B cells. Immune cells have many proteins on their surface. Researchers are able to identify immune cells in the blood by their surface proteins. In this experiment, to identify T cells and B cells, fluorescently-labeled antibodies will be used to bind to T cell and B cell surface proteins. An antibody called CD3 will bind T cells and a CD19 antibody will bind B cells. For example, to analyze immune cells from blood by flow cytometry, you would:
Part 1: Preparation of blood cells for flow cytometry (Figure 1):
- Place blood in a tube.
- Add the fluorescently-labeled antibodies to the tube and let it sit (incubate) for 30 minutes in the dark. This must be done in the dark because light will diminish the brightness of the fluorescently-labeled antibodies. During this time, the antibodies will bind to the surface proteins of T cells and B cells.
- Add red blood cell (RBC) lysis buffer to the tube and let it incubate for 10 minutes. This buffer will lyse, or degrade the red blood cells while leaving the immune cells intact.
- Place the tube in a centrifuge and spin the tube for 10 minutes. During centrifugation, the tube is rotated at a high speed (about 1,800 revolutions per minute!). The promotes the separation of substances based on density. After centrifugation, the immune cells will be at the bottom (higher density) and the red blood cell debris will be towards the top of the tube.
- Remove and discard the top layer of liquid from the tube, leaving the immune cells in the tube.
- Add phosphate buffered saline (PBS), a salt solution that keeps the cells at a stable pH balance. You can additionally add formaldehyde which preserves the cells.
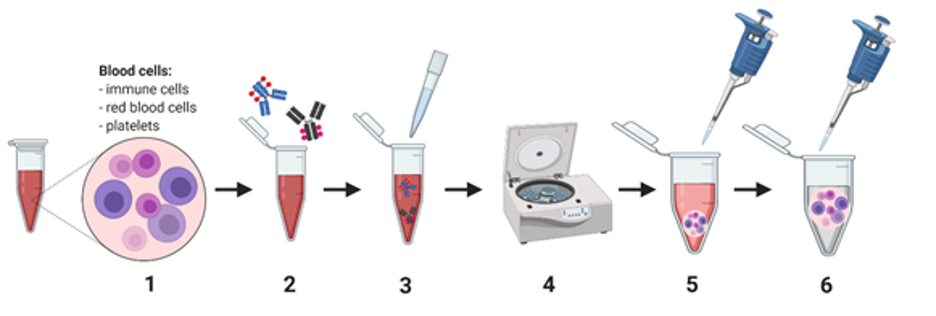
Figure created in Biorender
Part 2: Running cells through a flow cytometer (Figure 2):
- Load your sample tube onto the flow cytometer. The cells will then be sucked up by the machine and lead through a narrow channel, causing the cells to form a single file line before passing through a laser. As the cells pass through the flow cytometer, lasers shine on each individual cell. Light will reflect off the cells (scatter) that are tagged with a fluorescent antibody (in this case, the T cells and B cells). The amount of light that comes off of the tagged cells is collected by a photodetector (light sensor) and this amount is quantified and recorded by the machine.
- Using flow cytometry computer programs, you can analyze your data to quantify each cell type and analyze the size and shape of the cells in your sample. Immune cells will cluster into three different groups. T cell and B cells will be in the lymphocyte group (see figure 2). You can further quantify T and B cells in your sample because of the two different antibodies used (CD3 for T cells and CD19 for B cells).
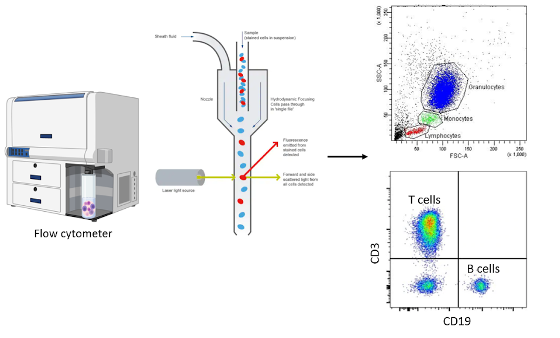
Figure 2: Running blood samples through a flow cytometer and analysis of immune cells.
Image sources: Flow cytometer image created in Biorender, flow cytometer schematic, top flow cytometry plot, bottom flow cytometry plot
Flow cytometry is a powerful tool with multiple applications that has been instrumental in the diagnosis and treatment of diseases and is a fundamental technique for researchers world-wide. The use of flow cytometry to this day is helping researchers make big strides in advancing knowledge of cancers such as leukemia, autoimmune diseases, infectious diseases, and more!